
RootLytics Business Intelligence
RootLytics Business Intelligence
MRR, churn rate, and customer lifetime value — all on one dashboard. See which customers are about to leave before they do.
The churn risk score that flags at-risk customers early so you can act.
Pre-loaded with realistic data · Your session is private · Resets after 2 hours
- Unified SaaS dashboard — MRR, churn, LTV, and usage in one view
- smart churn signals — identify at-risk customers early
- Cohort analysis — see which acquisition channels bring the best customers
- Revenue forecasting — model next quarter's MRR
- Connects revenue to behaviour — correlate feature usage with retention
Problems we solve & What you get
Before
Stripe for revenue, Mixpanel for usage, spreadsheet for MRR calculations, no churn prediction, decisions based on lagging indicators
After
Unified SaaS dashboard: MRR, churn, LTV, cohort analysis, usage correlation, smart churn signals — decisions based on forward-looking intelligence
Problems we solve
- SaaS founders track MRR in Stripe, churn in a spreadsheet, and usage in Mixpanel. There's no single view that connects revenue to behaviour.
- I can see MRR in Stripe but I can't see which customers are driving it.
- I only find out someone churned when I see the failed charge.
- My investor asks for cohort retention — I spend a day building it in Excel every quarter.
- I know my churn rate but I don't know why people are leaving.
- I have no idea what my trial-to-paid conversion looks like by pricing tier — just a blended average that hides everything.
What you get
- Unified SaaS dashboard — MRR, churn, LTV, and usage in one view
- smart churn signals — identify at-risk customers early
- Cohort analysis — see which acquisition channels bring the best customers
- Revenue forecasting — model next quarter's MRR
- Connects revenue to behaviour — correlate feature usage with retention
Why it works better
See it in action
The moments that make you think: "This is exactly what I needed"
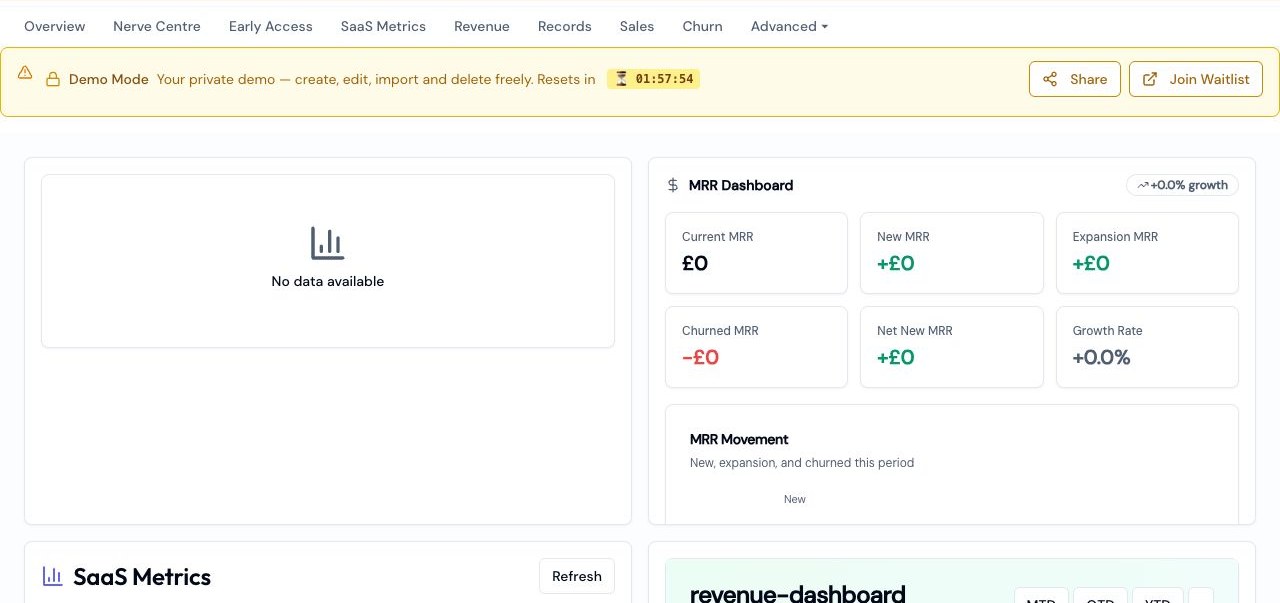
Working interactive demo with source-aware MRR, SaaS metrics, and revenue views
“MRR, growth rate, and churn are right there on my home screen — I don't have to dig through any sub-tab to see the number that matters most.”
When: Founder lands on the dashboard right after onboarding
“It identified customers at risk of cancelling from their usage patterns, so I knew who to contact.”
When: Founder sees customers flagged as likely to churn

smart churn signals surface at-risk customers early so the team can follow up

Cohort analysis reveals which acquisition periods bring your best customers — no spreadsheet required
“One acquisition cohort retains better than another — now I can see which campaign brings better-fit customers.”
When: Founder sees cohort analysis showing Q3 customers retain better
“The forecast shows the projected MRR trend, so I can plan hiring with current revenue data.”
When: Founder checks next quarter's revenue forecast

Revenue forecasting powered by compound growth modelling supports hiring and spending decisions with current data

Automated anomaly detection surfaces unexpected MRR changes from failed charges
“An overnight MRR drop from failed charges triggered an alert before I checked the dashboard, so I could investigate promptly.”
When: Founder wakes up to an anomaly alert email
“After connecting Stripe, the dashboard populated with my MRR, ARR, churn rate, and top customers.”
When: Founder connects Stripe for the first time and sees their dashboard populate

Connect Stripe to populate a SaaS metrics dashboard with MRR, ARR, churn, and LTV

Cross-correlation engine reveals which features predict retention — no SQL, no data analyst required
“The analysis linked CSV export adoption with retention — now I know what to investigate in the next sprint.”
When: Cross-correlation engine surfaces a statistically significant feature–churn pattern
“I didn't have to export anything — the rent TerraLedger collected this morning is already counted in my MRR here.”
When: Council rent payment posts in TerraLedger and the operator checks RootLytics minutes later

TerraLedger rent, allotments.info listing fees, and every other recipe's revenue — one MRR number, synced automatically
Ready to explore?
Your sandbox is pre-loaded with realistic RootLytics Business Intelligence data.
No sign-up, no credit card — just click and go.
Prefer to get early access? Join the waitlist